Tab-hopping for
an incomplete picture
- Shopify
- Meta Ads
- Google Ads
- Amazon
- Flipkart
- Logistics
- Spreadsheet

The only fully customizable AI platform powered by Rocket, to unify your sales, ads, inventory, and operations and answer any business question from your real data.
Rated 4.3/5 on TrustPilot
No credit card required
Live in one day
Connected to:
 Facebook
 GA4
GA4 Google Ads
 Instagram
 iThink
 Judge.me
 Meta Ads
 Shopify
 Unicommerce
 Amazon
 Flipkart
 Myntra
 Eternz
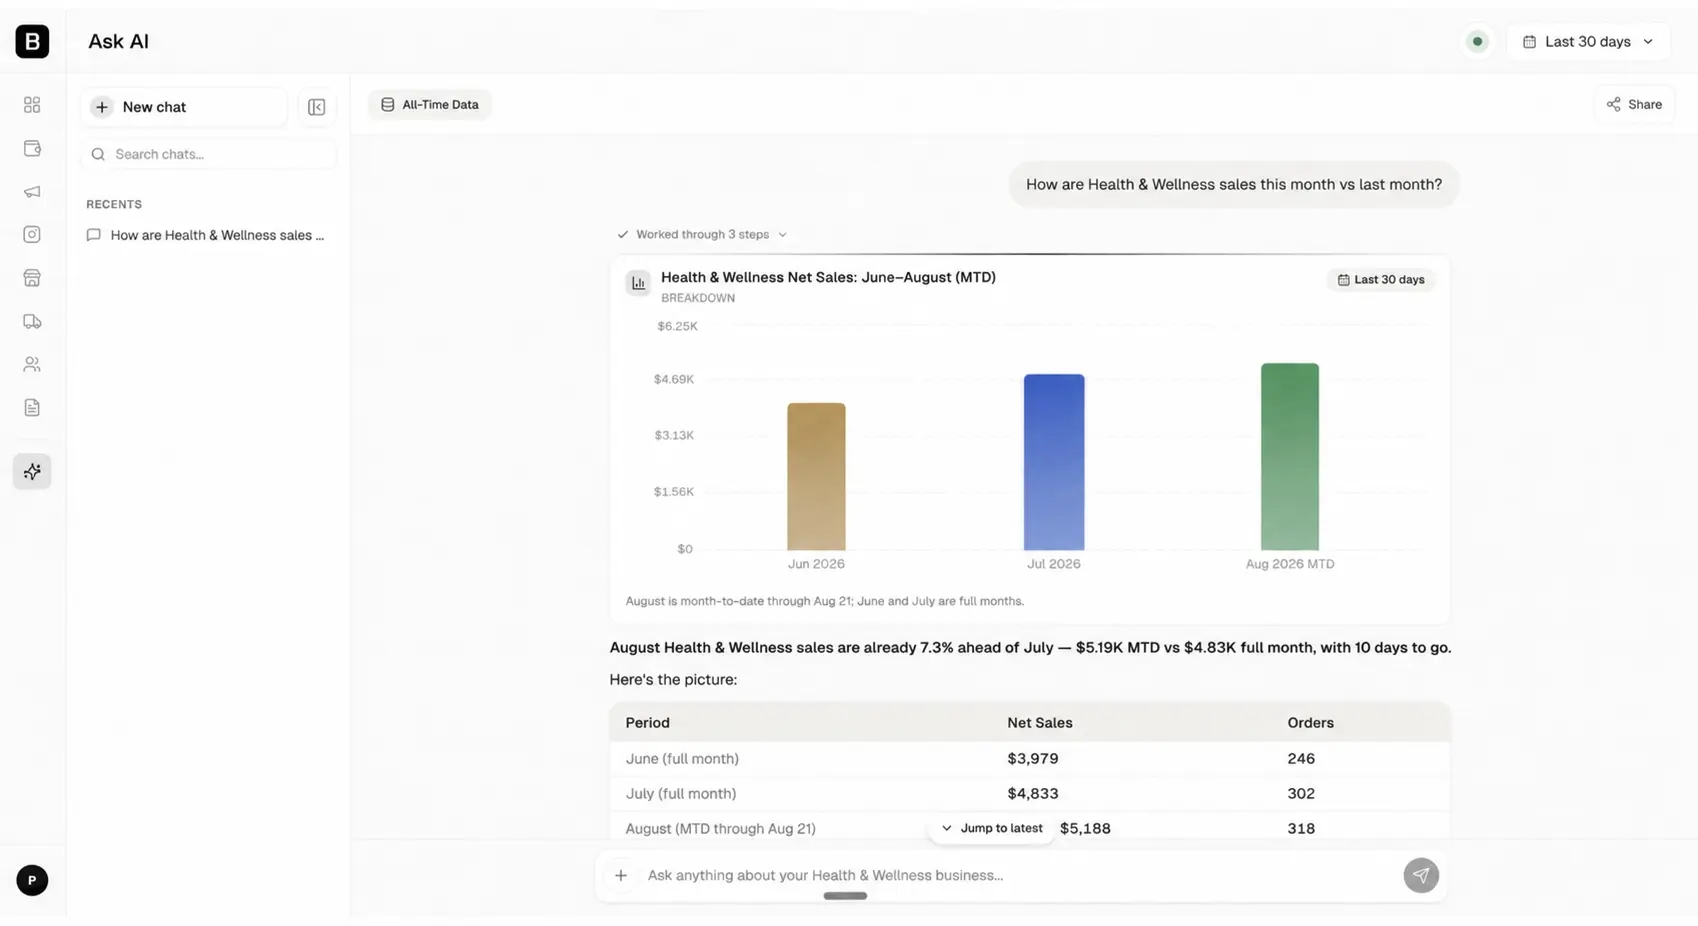
Shopify is your biggest revenue channel at $18K, but whether it is also the most profitable is something I want to confirm with a margin query — more on that below.
Sales ranking — all channels, all time
| Channel | Net Sales | Orders | Share |
|---|---|---|---|
| Shopify (D2C) | $18,204 | 4,455 | 50% |
| Myntra | $6,856 | 1,769 | 19% |
| Amazon | $5,418 | 1,315 | 15% |
| Eternz | $3,637 | 924 | 10% |
| Flipkart | $2,127 | 523 | 6% |
Shopify alone drives half your revenue and more than half your orders. No single marketplace comes close — Myntra is the next biggest at just 19%.
What's driving it
Shopify's dominance on revenue reflects the higher average order value that typically comes with D2C (no marketplace commission eating into the price, and you control the full selling price). Myntra and Amazon together add another 34%, which is meaningful but secondary. Eternz and Flipkart are relatively small contributors.
Does biggest = most profitable?
On sales alone, Shopify wins clearly. On net margin, the picture usually flips somewhat for D2C vs marketplace channels:
Unfortunately the margin database is not responding right now — I cannot give you the exact margin-per-channel figures this minute. Try asking "show me net margin by channel" in a moment and I will pull those numbers as soon as the connection is restored.
Heads up: With 3,575 cancellations across all channels (out of 8,986 orders placed), nearly 40% of all orders placed never result in a sale. This is a significant drag on your gross-to-net funnel regardless of channel and worth investigating urgently.
Shopify
$9,838
Ads
$7,038
Sheet
$8,520
1–2 hrs
lost every morning
8–12
platforms, zero sync
Always late
to catch RTO & leaks
What is Brandstack?
D2C brands run across a dozen platforms that never talk to each other. Brandstack connects them via APIs and pulls every relevant number into one live system — then organises it around the decisions a founder actually makes: what's profitable, what's leaking, and what needs attention right now.
Not just a data dump. Decision logic is baked in — and an AI assistant answers in plain English using your brand's live data, not generic advice.
Channels
5
Net sales
$7K
Avg margin
32.1%
Net sales and margin across Shopify + marketplaces.
84 orders · $3K
41 orders · $1K
52 orders · $1K
19 orders · $485
26 orders · $209
Reports
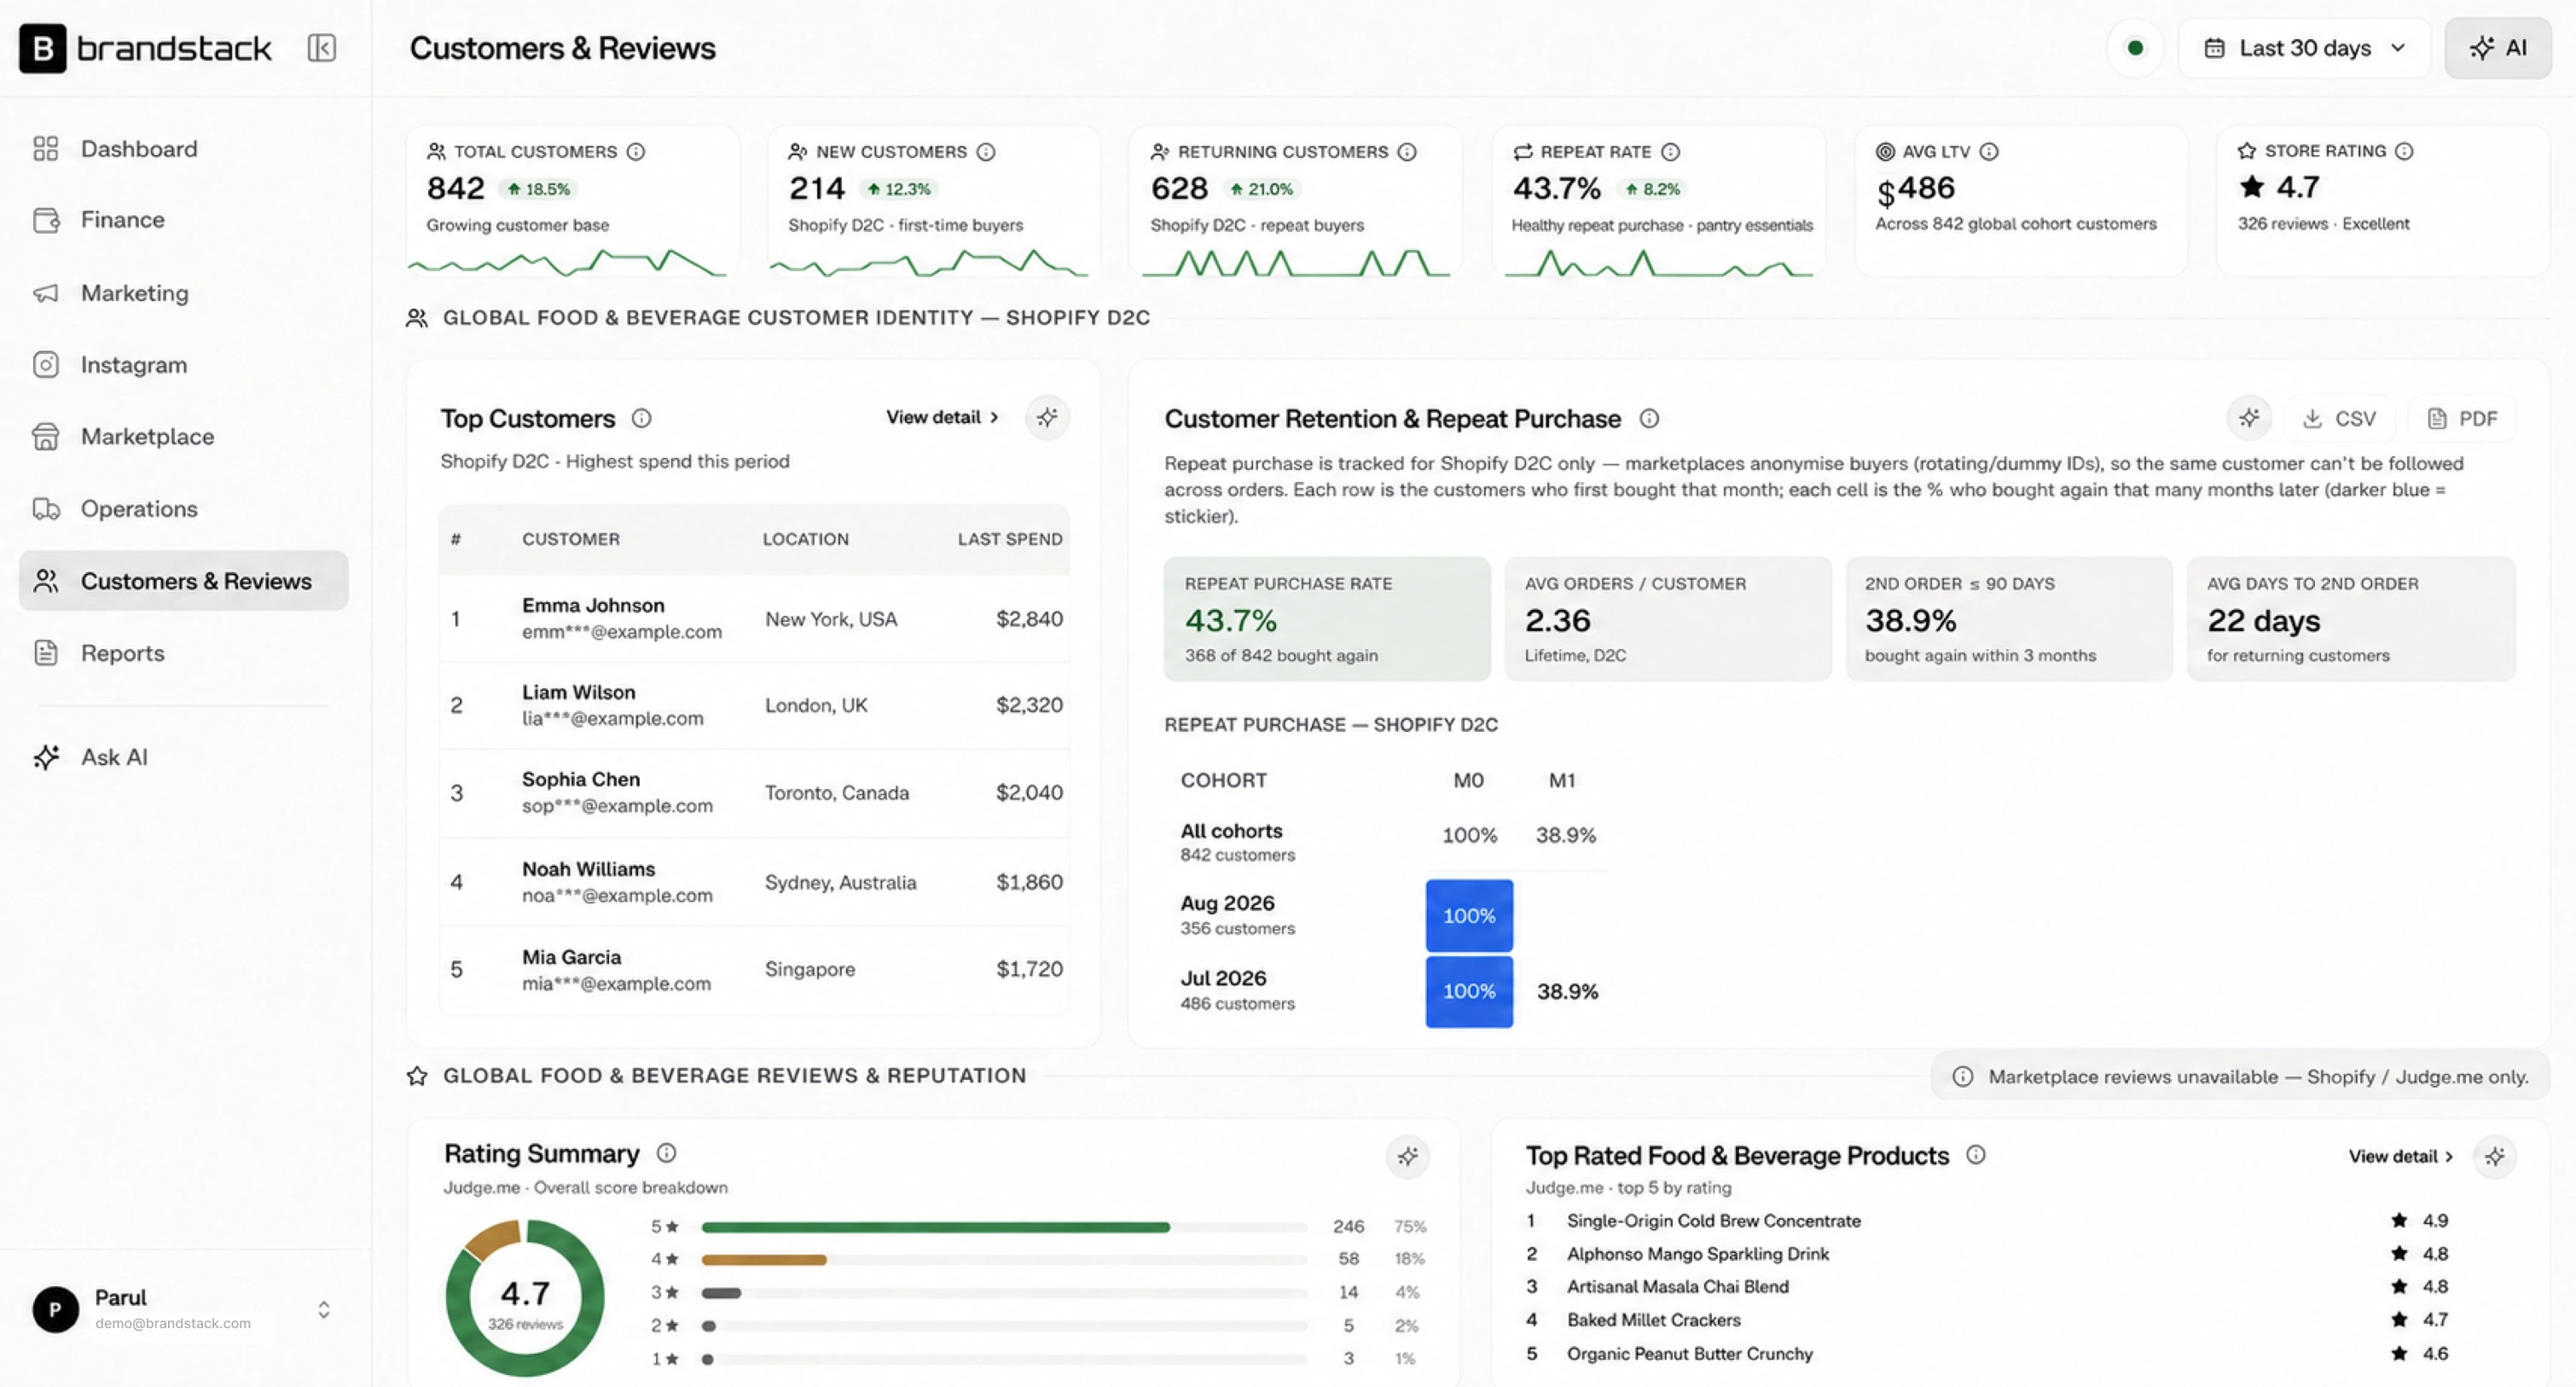
Owner reviews, SKU contribution, marketplace fee leakage, kit vs single promo lift, COD remittance, and reorder signals — filter, favourite, share. An analyst in a module.
Finance
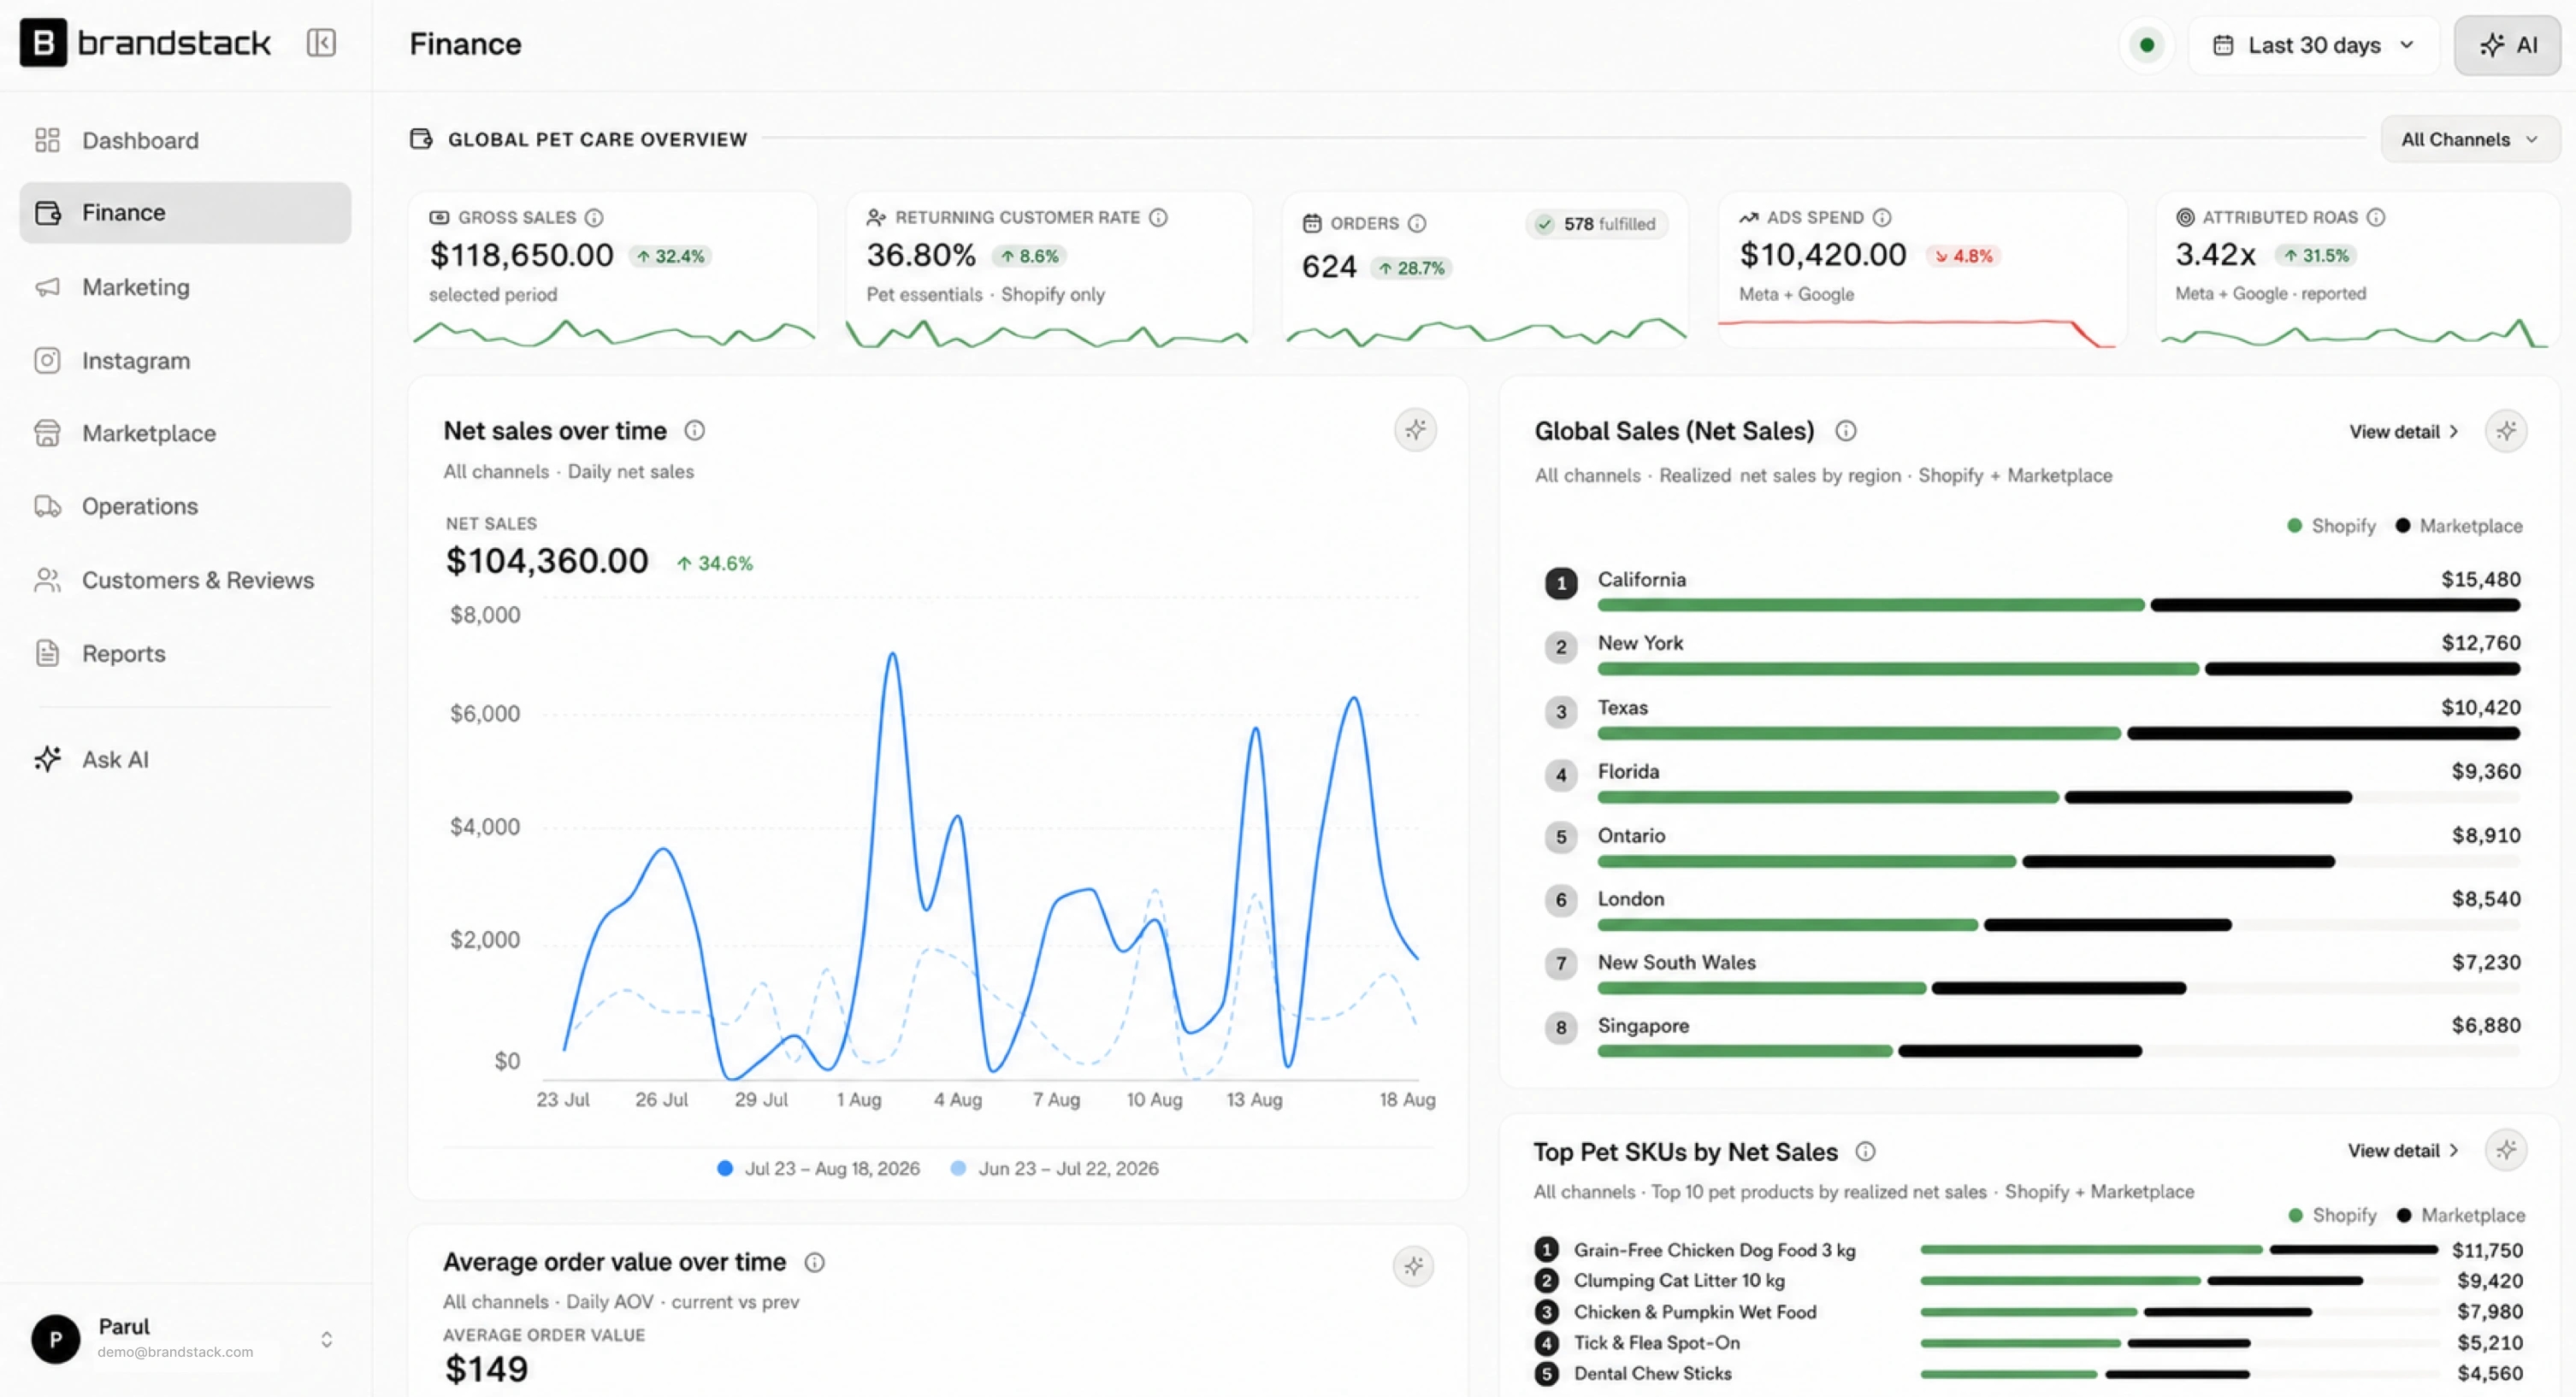
Sales Summary waterfall for high-AOV catalogs — net by channel, COD vs prepaid, contribution after returns, and top jewelry or beauty SKUs by real bank margin.
Gross sales
$9,979
−12.4%
Net sales
$6,039
+6.1%
AOV
$30
+30.0%
Current vs previous period
Payment mix
COD 106
Prepaid 65
By channel
Sessions
18.4k
+8.2%
Ad spend
$1K
+3.1%
ROAS
3.4x
+0.4
CAC
$5
−6.0%
Last 30 days
Impressions
2.1M
Clicks
64.2k
Purchases
1,184
Marketing
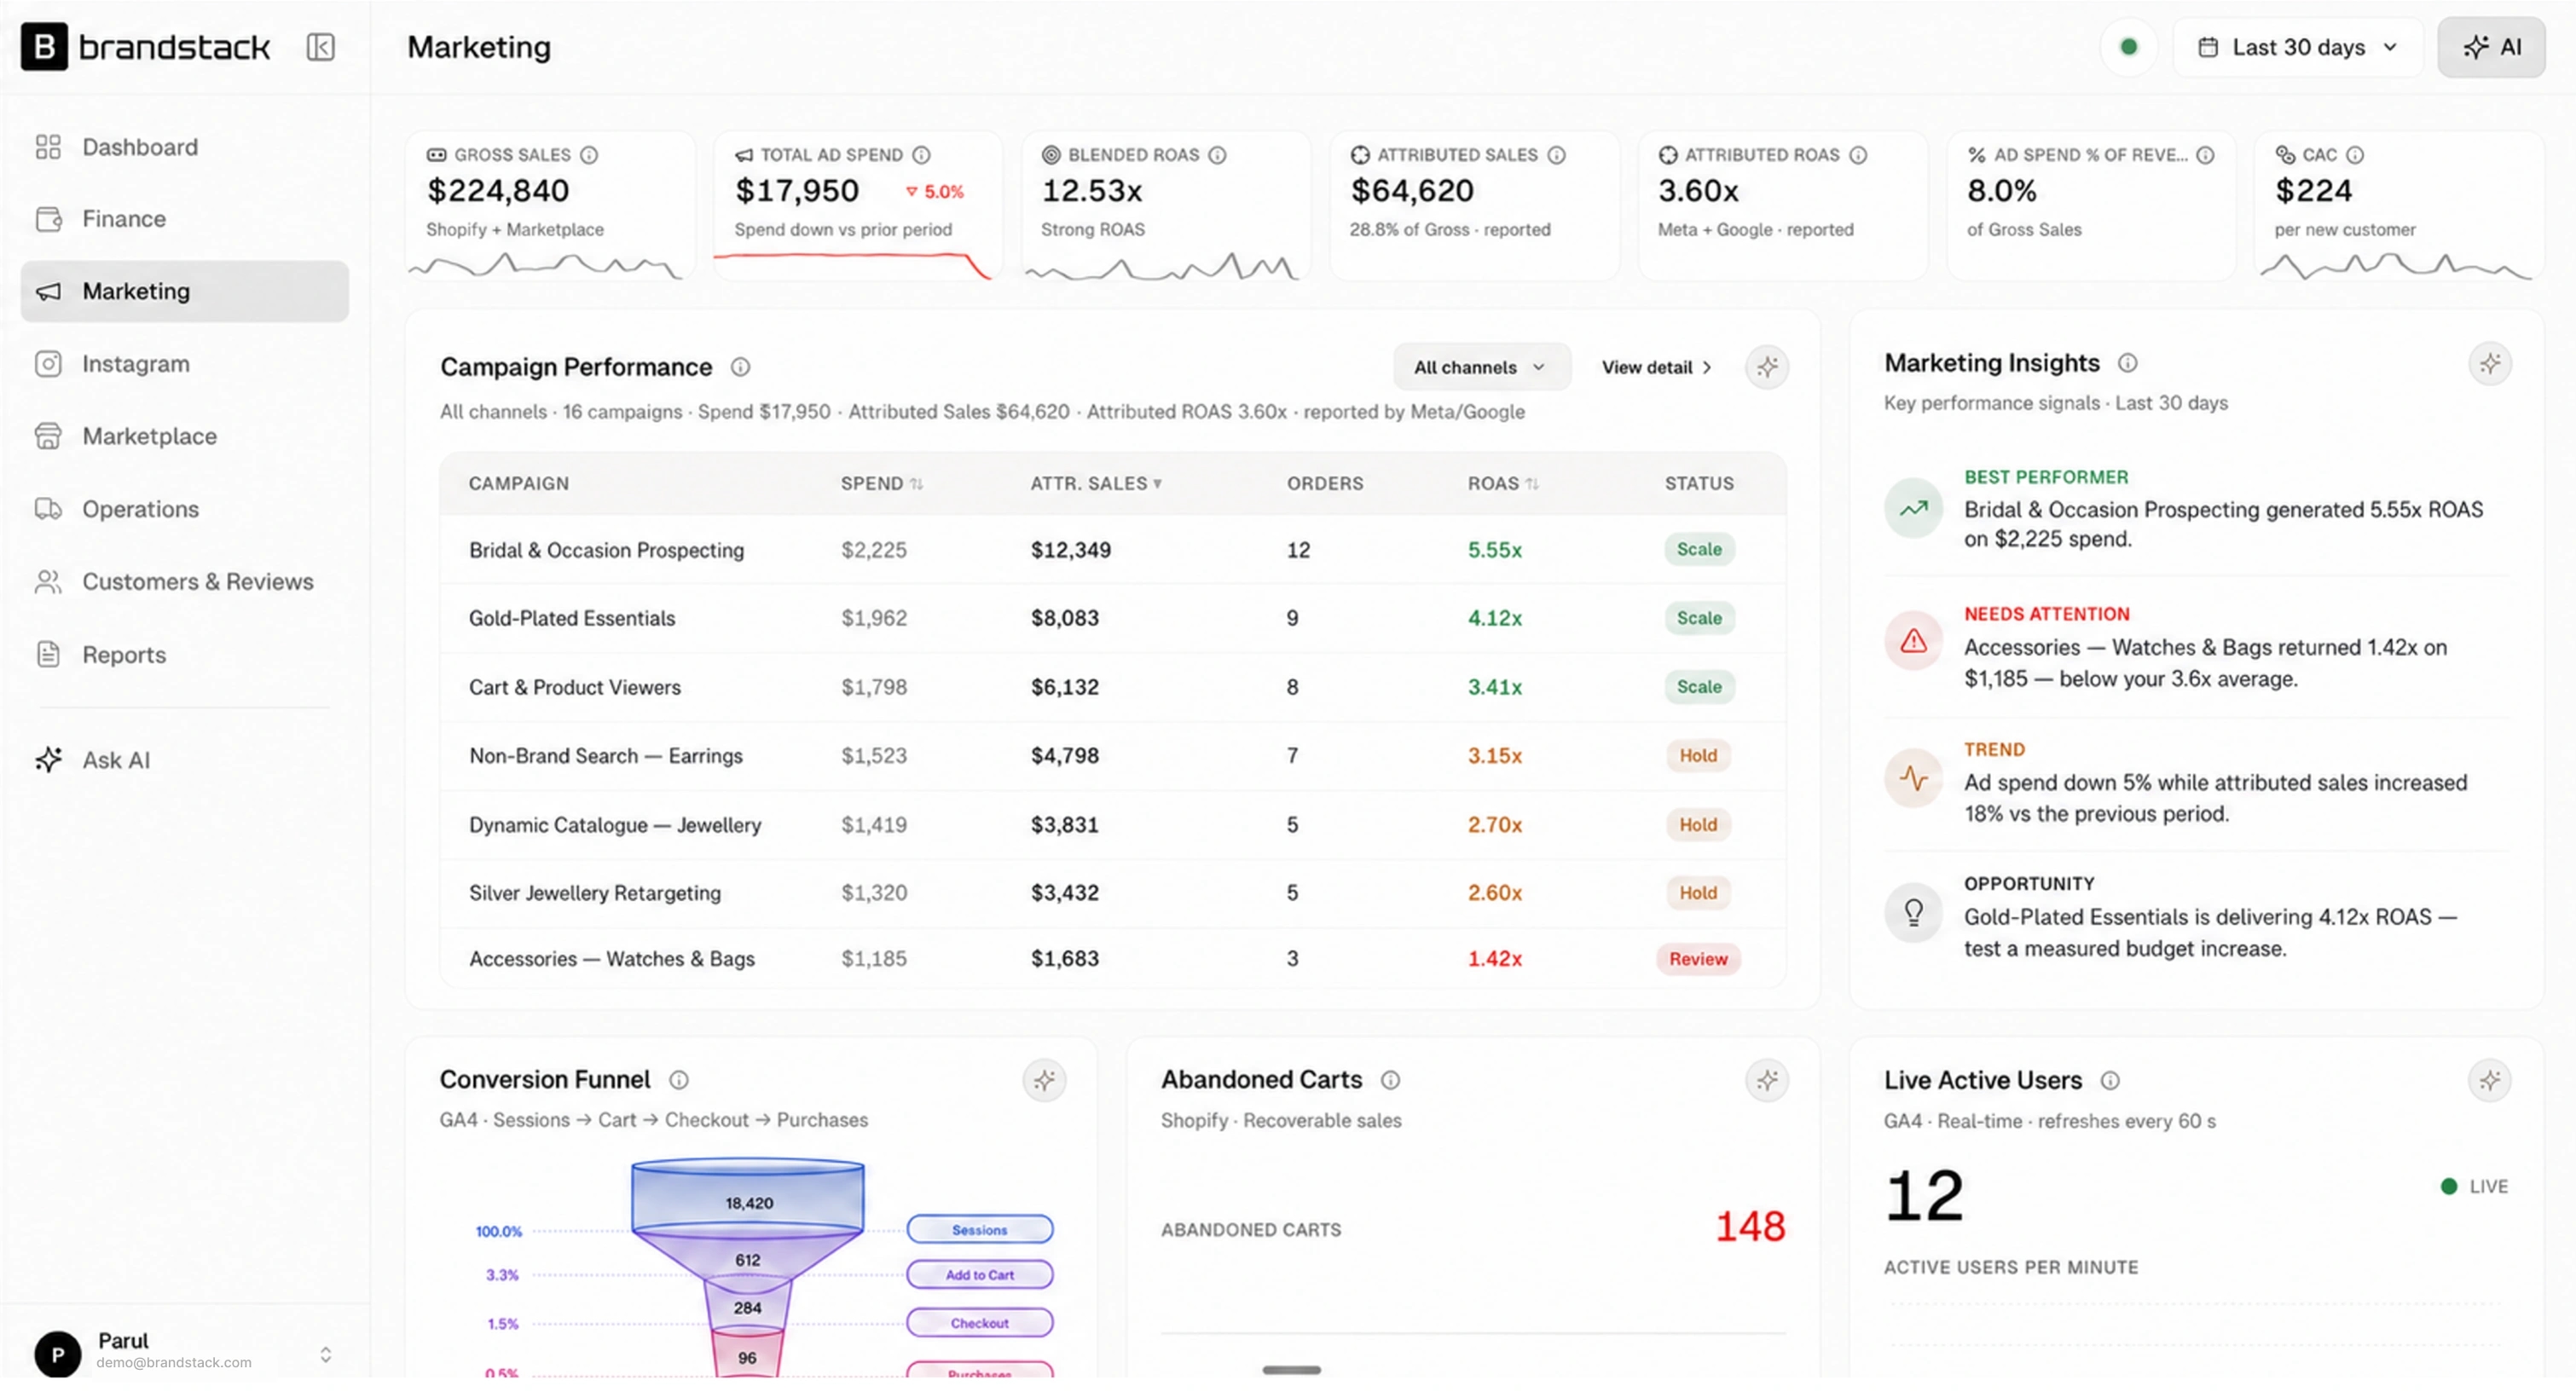
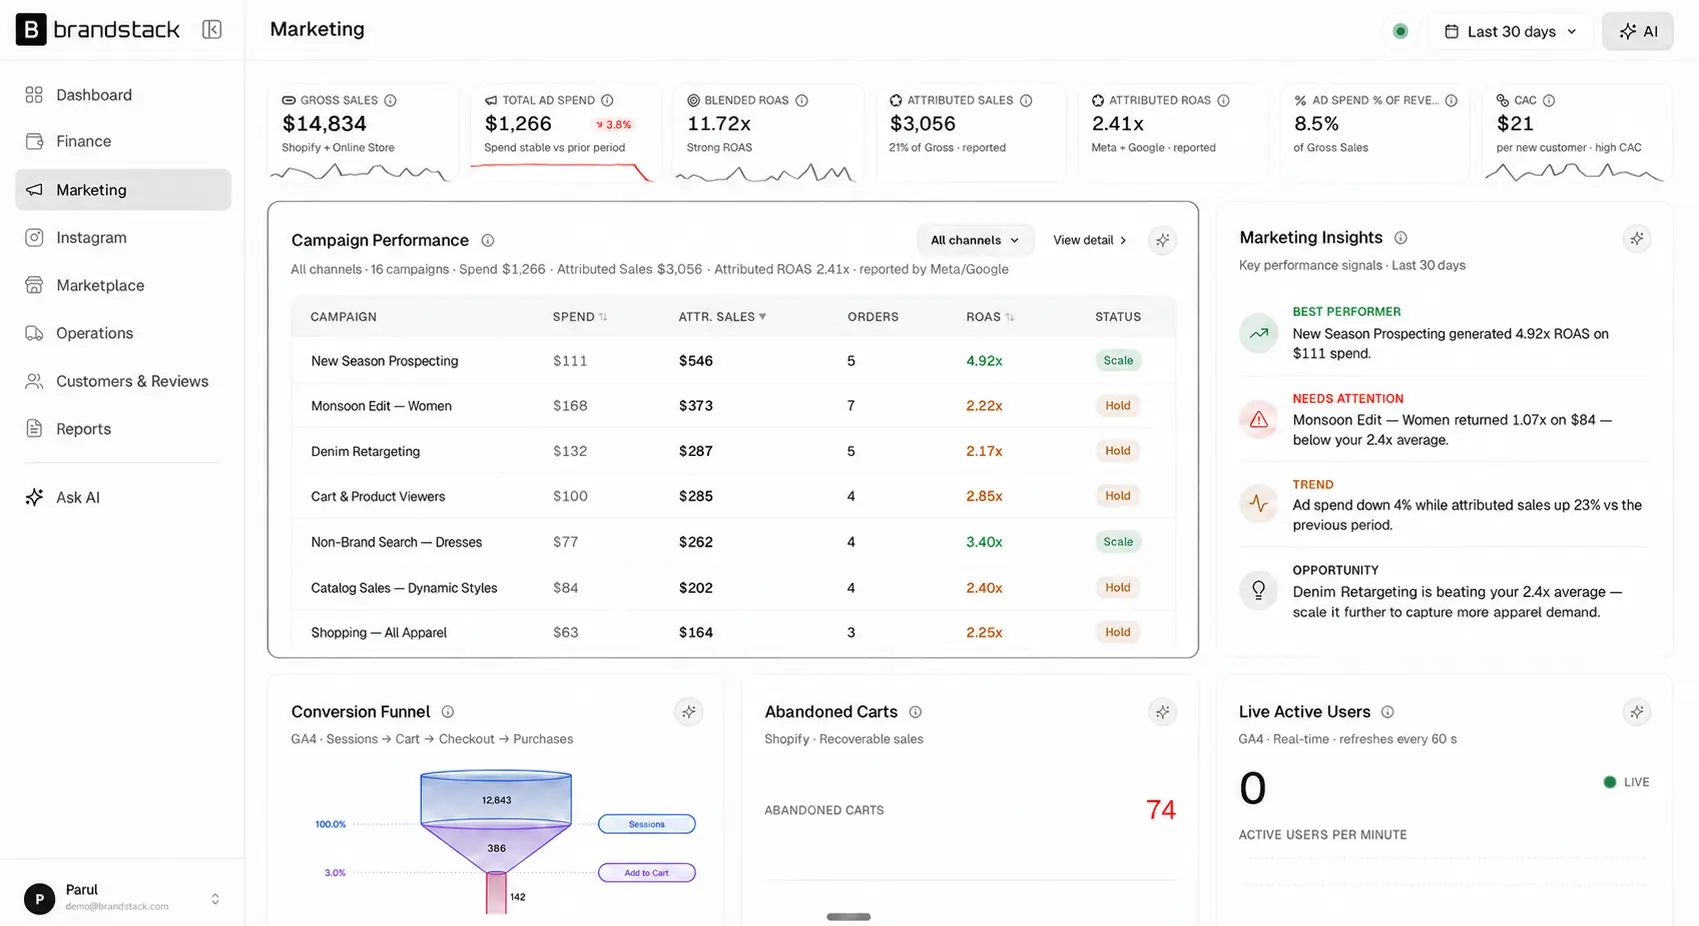
Spend vs revenue on the SKUs that convert — creative fatigue, placements, and Scale / Cut / Monitor without reconciling four ad logins by hand.
Marketplace & ops
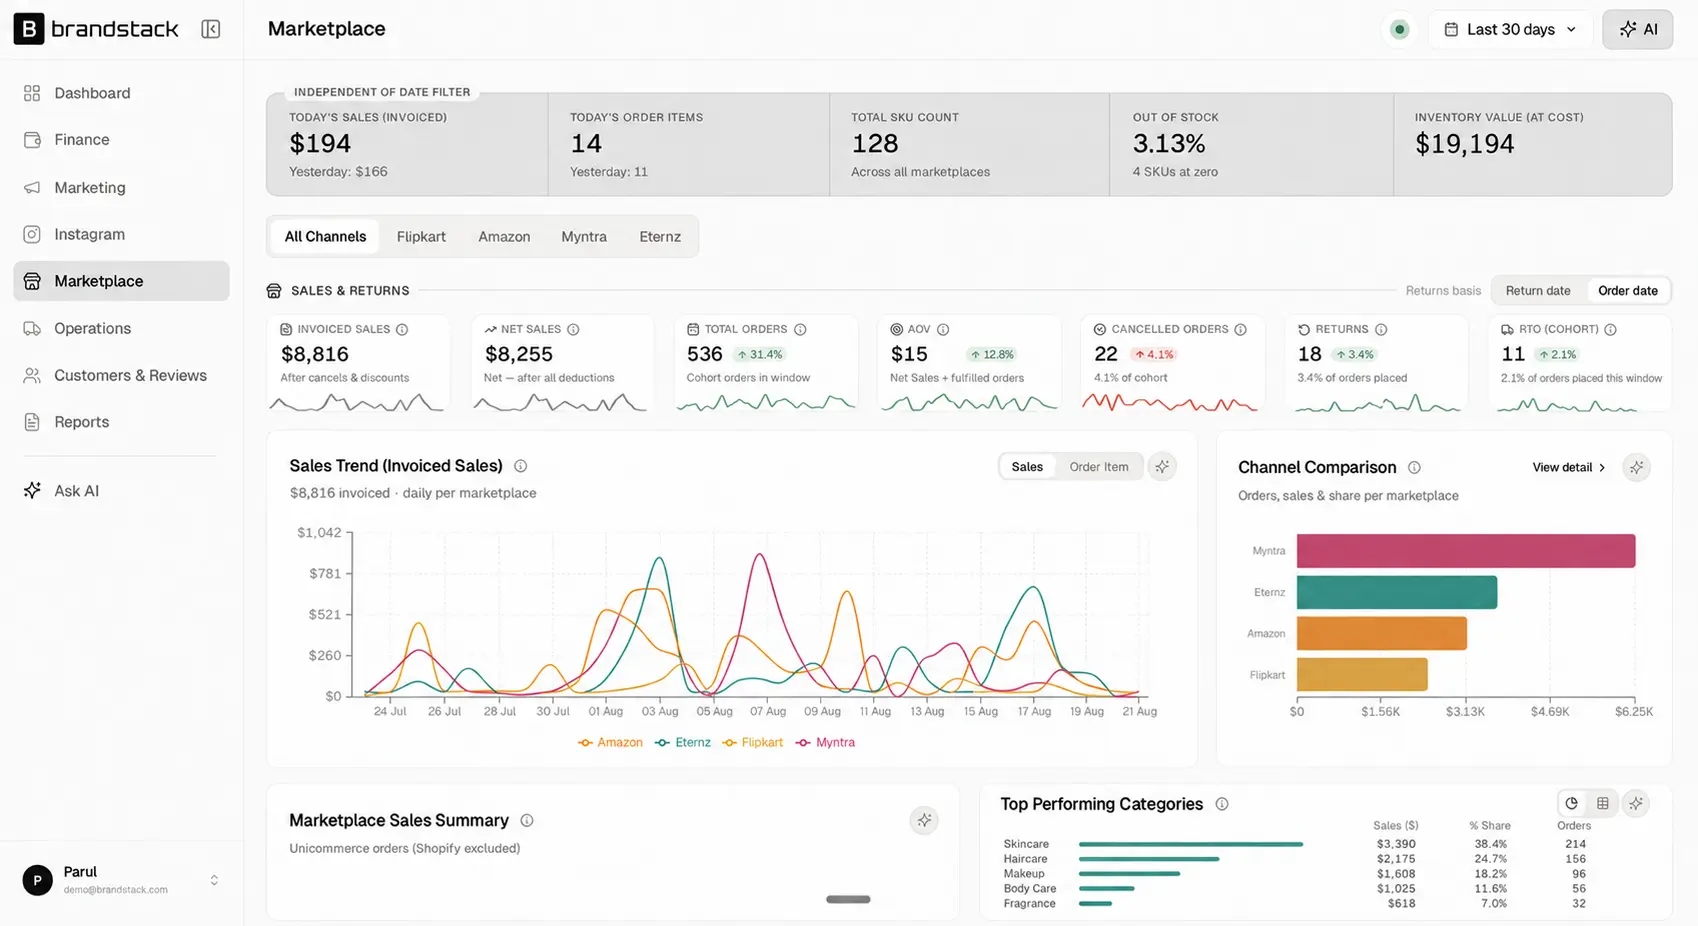
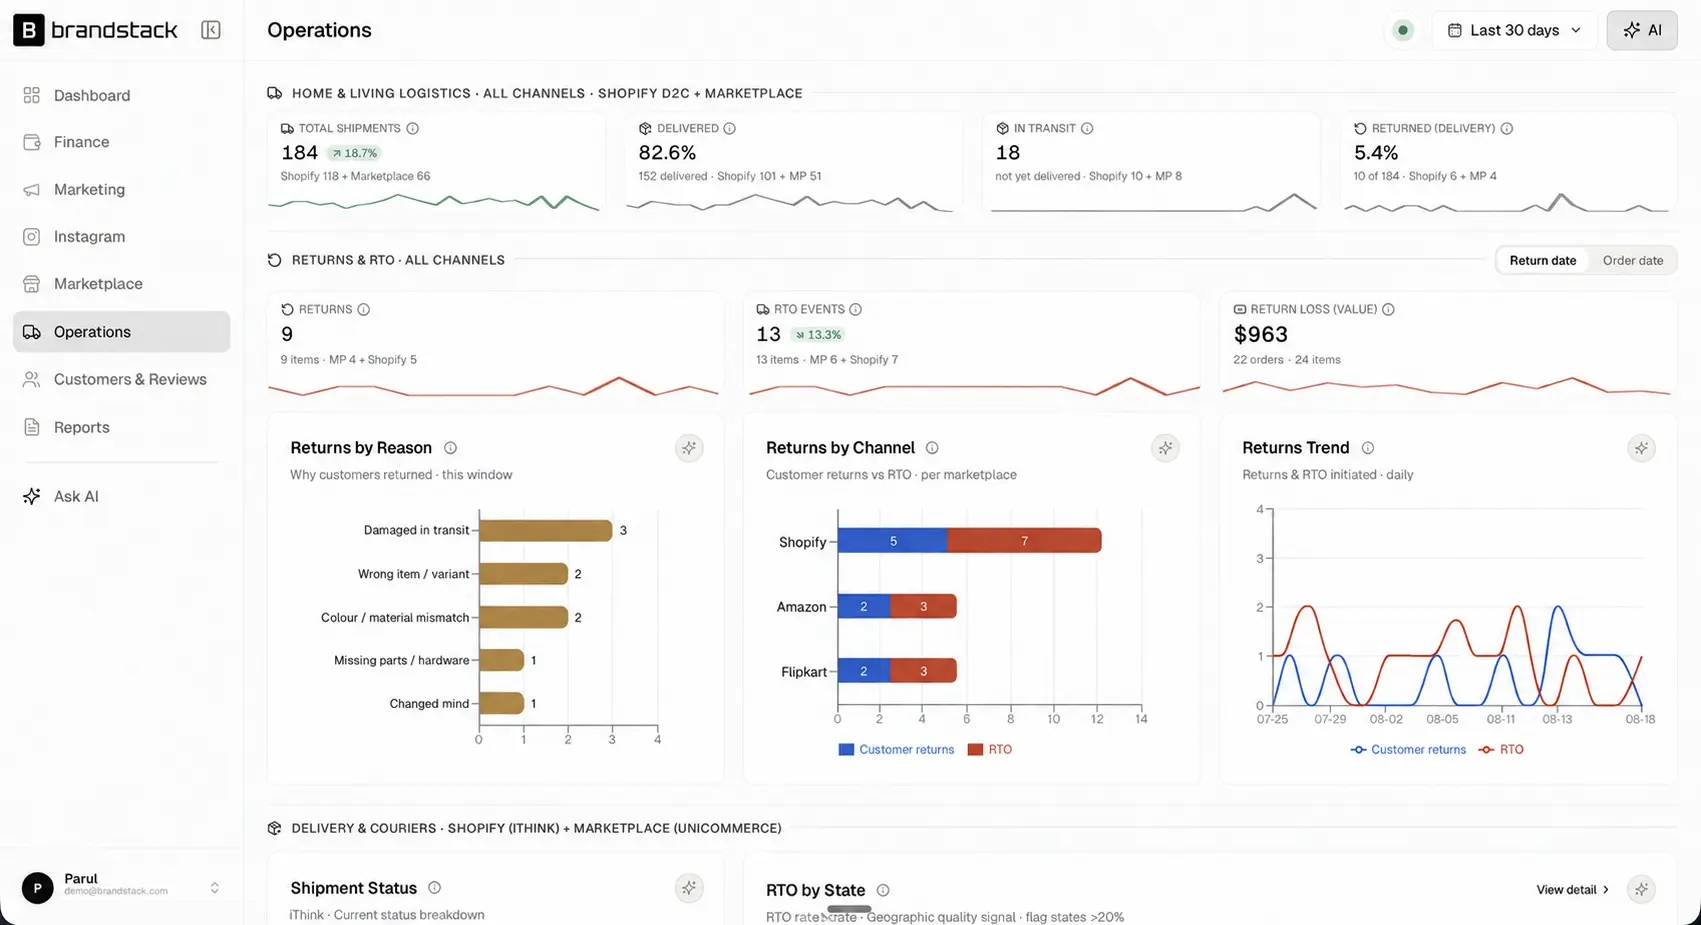
Amazon, Myntra, and more — fast movers, dead stock, RTO by state, courier performance, and return reasons that tell you what to fix.
Invoiced
$7K
Orders
171
AOV
$43
OOS
4.2%
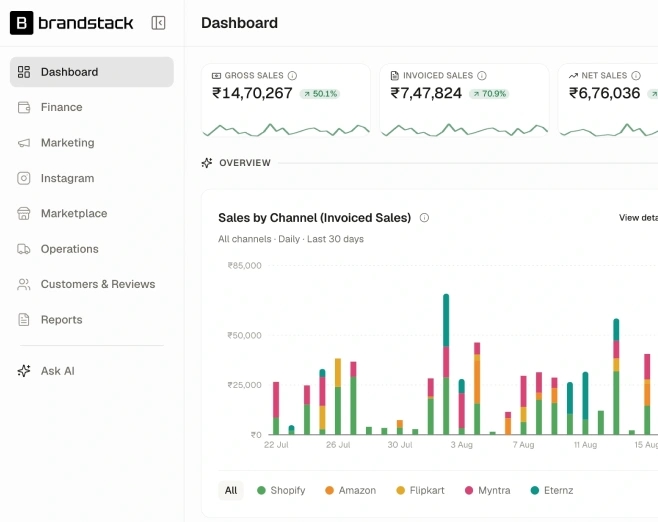
Invoiced sales by marketplace
Dashboard & beyond
Gross-to-net, State Action Matrix, SKU profit Pareto, anomaly alerts, logistics, customers, Instagram, and more — one screen to start, nine modules when you need depth.
Sizes, seasons, and returns pile up fast — see SKU contribution after marketplace fees, RTO, and ad spend so you scale the lines that pay.
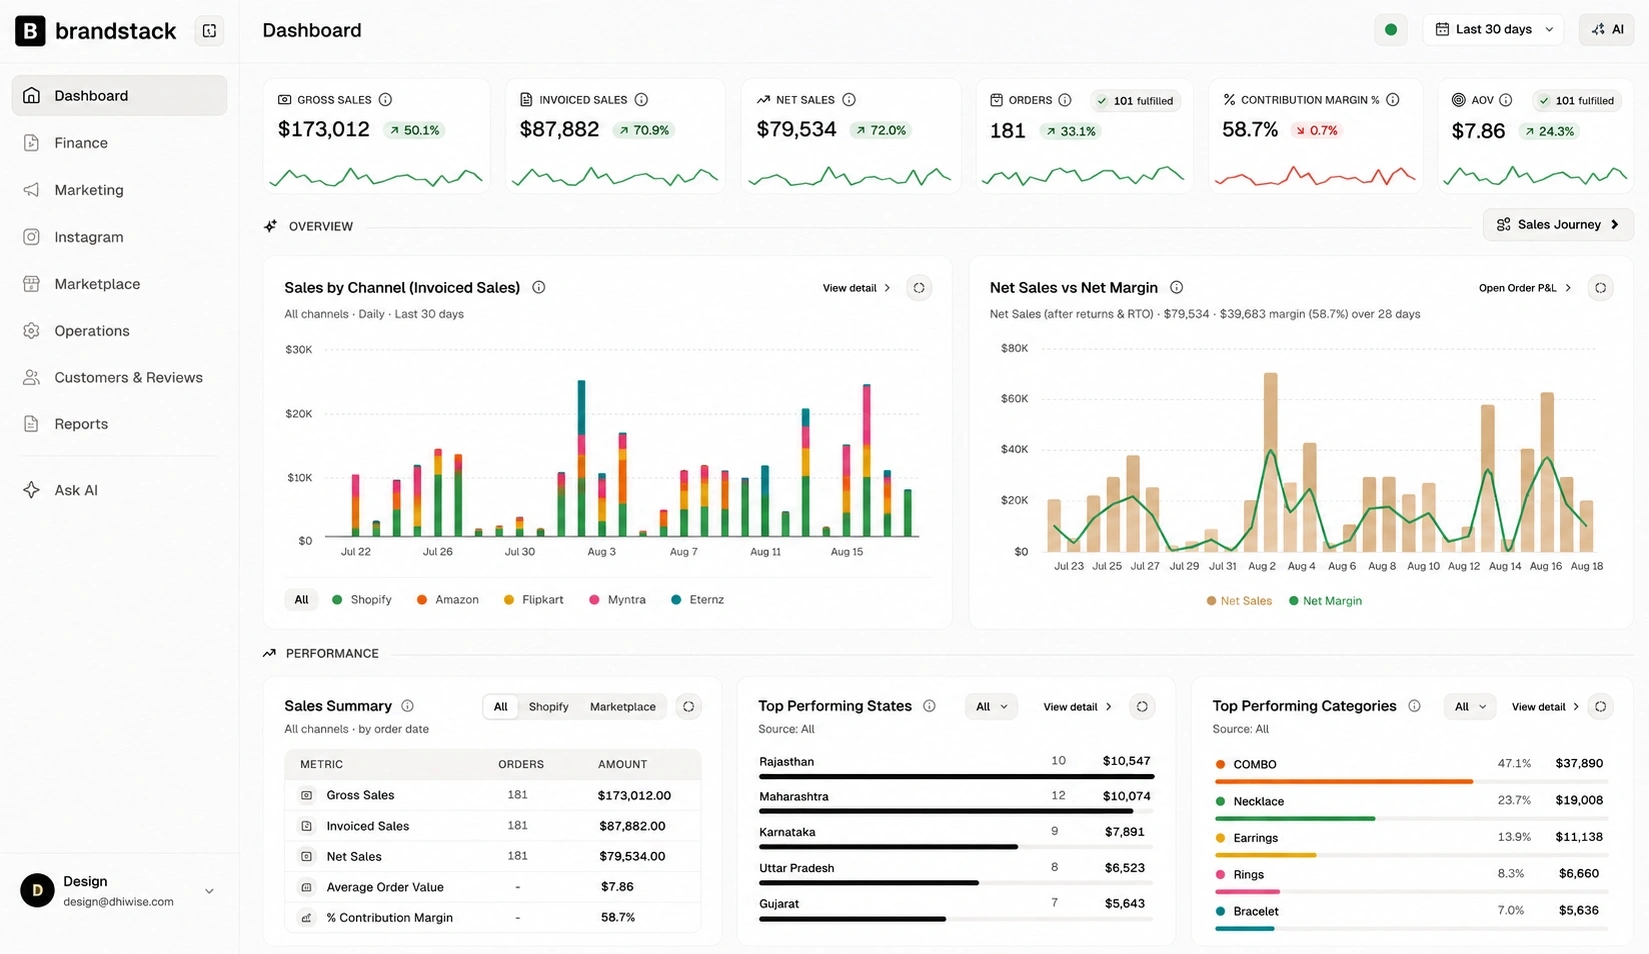
Connect each source with OAuth — minutes per integration, not days. From then on, the picture updates itself.









01
Connect your stack. Shopify, Meta, Google, GA4, marketplaces, logistics — link once via OAuth.
ShopifyGoogle AdsMeta AdsNumbers don’t match
02
Everything syncs live. Sales, ads, inventory, returns, and cash flow land in one reconciled view.
Today
Scanning…Shopify
Margin healthy
Pause spend · review creatives
Google Ads
On track
Pause spend · review creatives
Meta Ads
Watching
Pause spend · review creatives
03
Decide with clarity. Action labels, board-ready reports, and AI answers grounded in your data.
Custom
Starts at USD 250 per month
Path 01
Connect Shopify, ads, marketplaces, and logistics. One live picture of net margin, failed deliveries, and what to fix first. Ready from day one, no waiting.
Path 02
Everything in Path 01, plus new integrations and features built specifically for how your business operates. You tell us what is missing, we build it in.
Path 03
A completely new tool or solution designed and built from scratch around your business needs, powered by Rocket. Your idea, fully realized.
How Brandstack connects your stack, how it differs from dashboards and generic AI, and how your data stays secure.
Shopify for store orders; Meta Ads and Google Ads for paid; GA4 for traffic; Amazon, Flipkart, Myntra, and more via marketplace or Unicommerce; logistics partners like Shiprocket, Delhivery, and iThink. Connections use OAuth where available — minutes per integration, not days. If you use a platform not on this list, we evaluate it based on what access it provides. What we can connect is determined by what the third-party platform makes available — we'll tell you what's feasible before we promise anything.
No. Brandstack pulls live data into one system, then organises it around decisions — profitable channels, margin leaks, State Action Matrix labels, campaign Scale / Cut / Monitor signals, and an AI that answers from your actual numbers, not generic advice. A dashboard waits for someone to investigate it. Brandstack surfaces what matters and brings the insight to the right person, without someone needing to remember to look.
General AI tools can absolutely analyse data. The difference is that your team still has to make the analysis happen — collecting the data, cleaning it, uploading it, writing the right prompt, and repeating the whole process every time fresh analysis is needed.
Brandstack automates that operating layer: Pull → Clean → Organise → Map → Analyse → Notify.
The comparison isn't $250 versus the cost of a general AI tool. It's $250 versus the human time and operational effort required to continuously produce the same outcome.
You may not need to replace any of them. Brandstack focuses on removing the dependency between having the data and someone remembering to investigate it. Instead of requiring someone to continuously open dashboards and identify anomalies, Brandstack surfaces the relevant change automatically. It's designed to work alongside existing analytics teams and tools — not replace them.
Connections use OAuth where available, credentials are encrypted, and access is scoped only to the metrics Brandstack needs for reporting and analysis. We don't sell your data, and you can disconnect any source at any time. For dedicated deployments, your data is isolated within that configured environment. Brandstack structures and filters the context required for each analytical task — the objective is to keep unnecessary data exposure minimal and control what the AI layer sees for each query.
Brandstack's connectors are designed to read and pull authorised data for reporting and analysis. We are not creating campaigns, changing budgets, modifying ads, or performing any unrelated activity in your account. We use only the permissions required for the configured integration, following the supported API and authentication mechanisms each platform provides. Our access is deliberately scoped to analytics, not account management.
Most brands connect their core stack the same day. Link accounts via OAuth and Brandstack starts syncing sales, ads, inventory, returns, and cash signals automatically — no week-long implementation, no spreadsheet mapping.

Powered by Rocket.new
Brandstack is built on Rocket — the world's first Vibe Solutioning platform. Research the market, decide what to build, ship production-ready software, and stay ahead of what happens next. One system. One shared context.
Most AI tools help you build faster. Rocket tells you what to build, builds it, and keeps you ahead after you ship.



Backed by


Apps shipped
1.6M+
countries served
180
people build with us
1.5M+
TrustPilot Rating
4.3/5